
(The above shows the detailed seat counts for 20 venues. Some corresponding seating charts may be inaccurate — please refer to Ticketmaster for updates.)
Basically I checked the page source of the ticketmaster Canada & US to make these charts, posted on Rednote before 🙂 (http://xhslink.com/o/8GrxUnf1IXI)
NA Total: 372,662 (LA x 2, NY x 2)
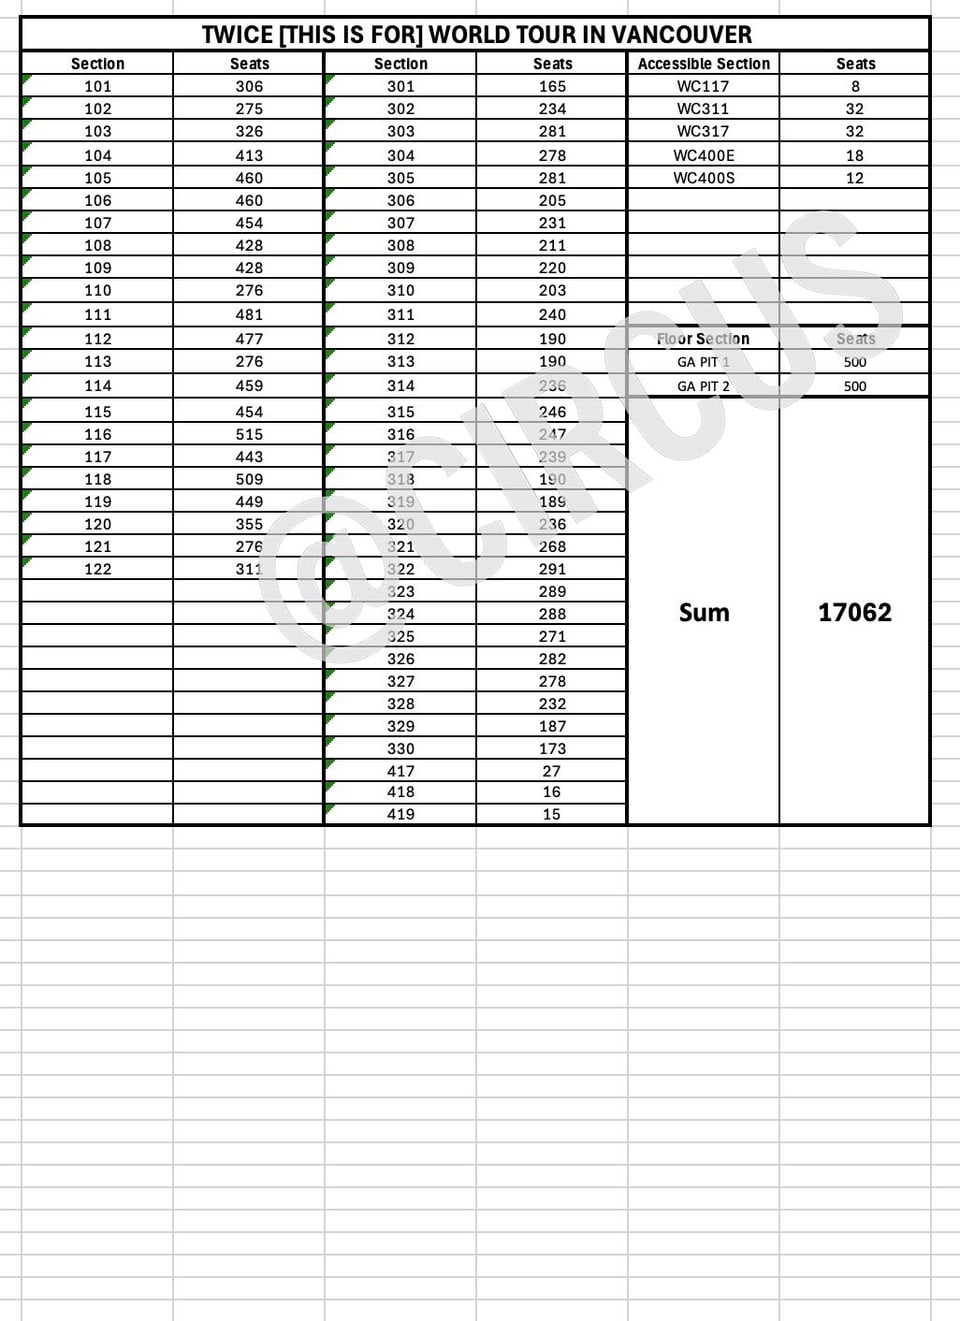
Vancouver: 17062 PIT 1000 (500 each)
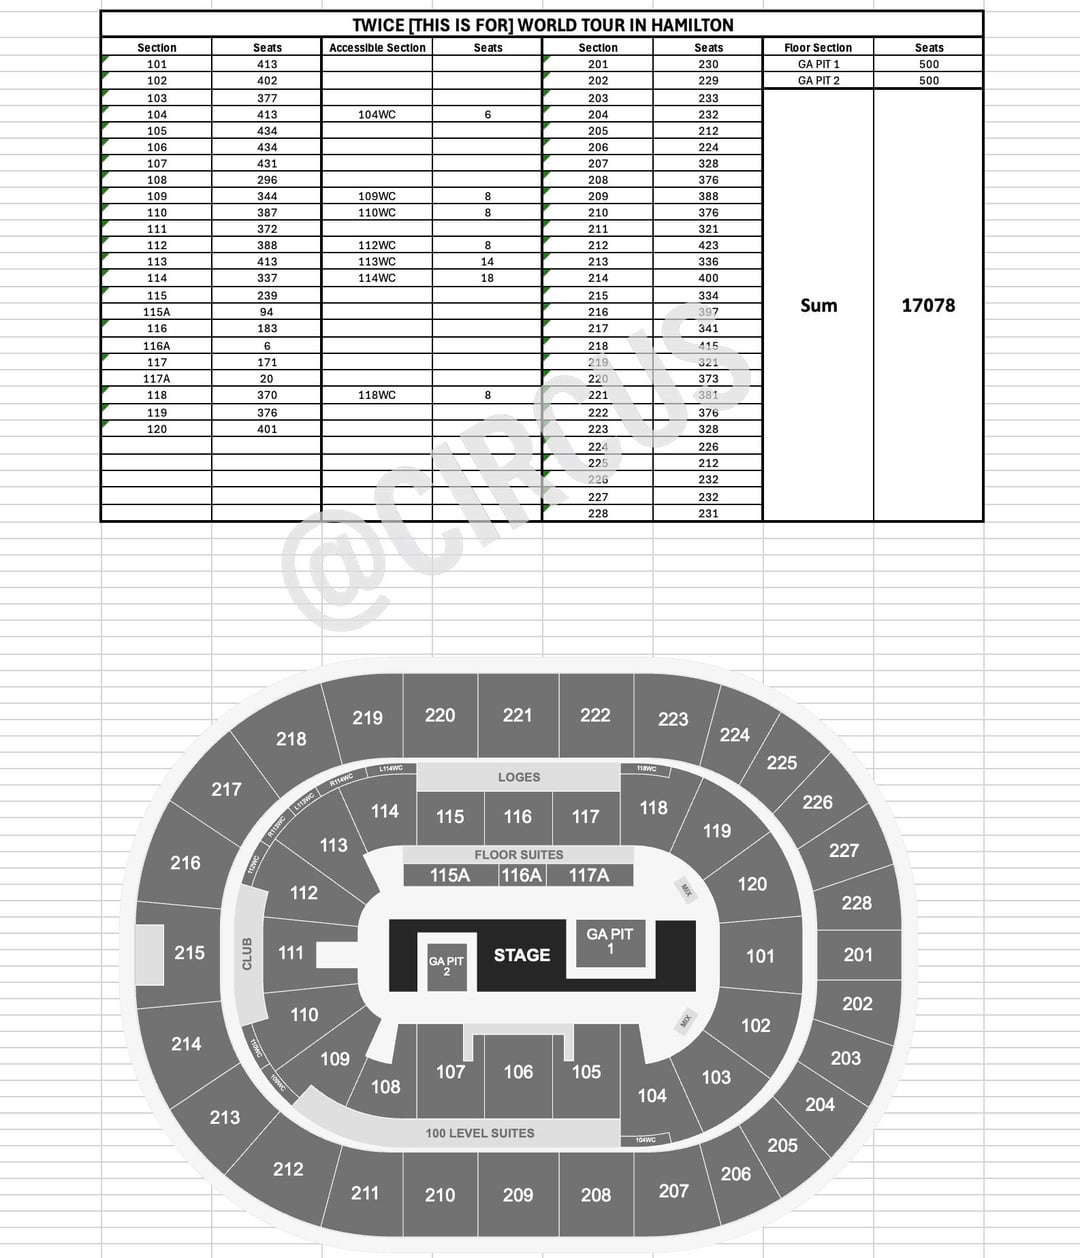
Toronto (Hamilton): 17078 PIT 1000 (500 each)
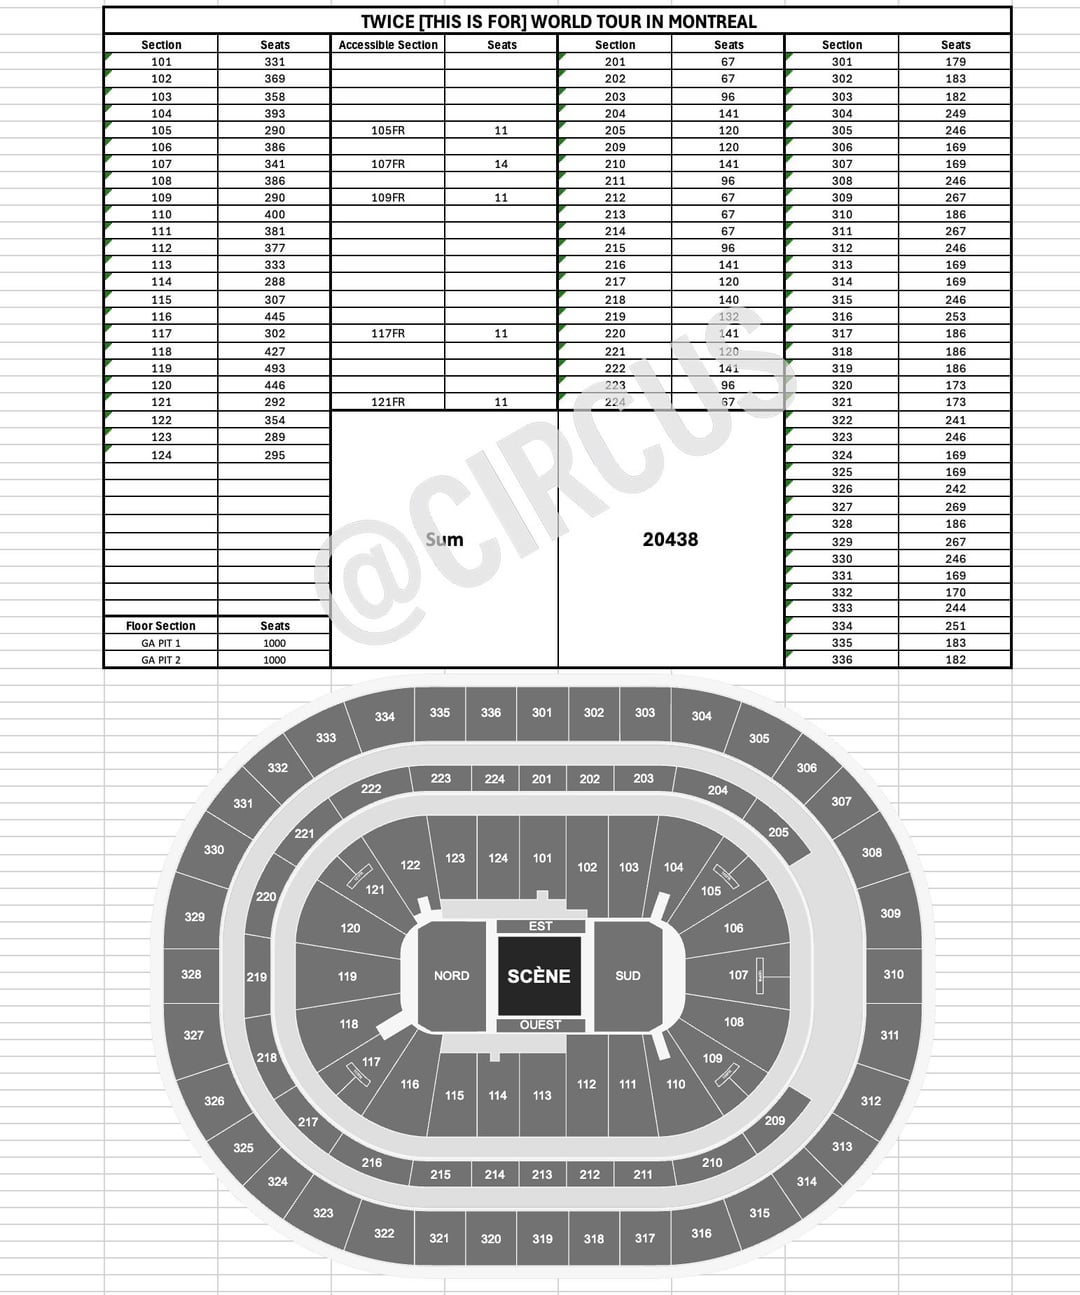
Montreal: 20438 PIT 2000 (1000 each)
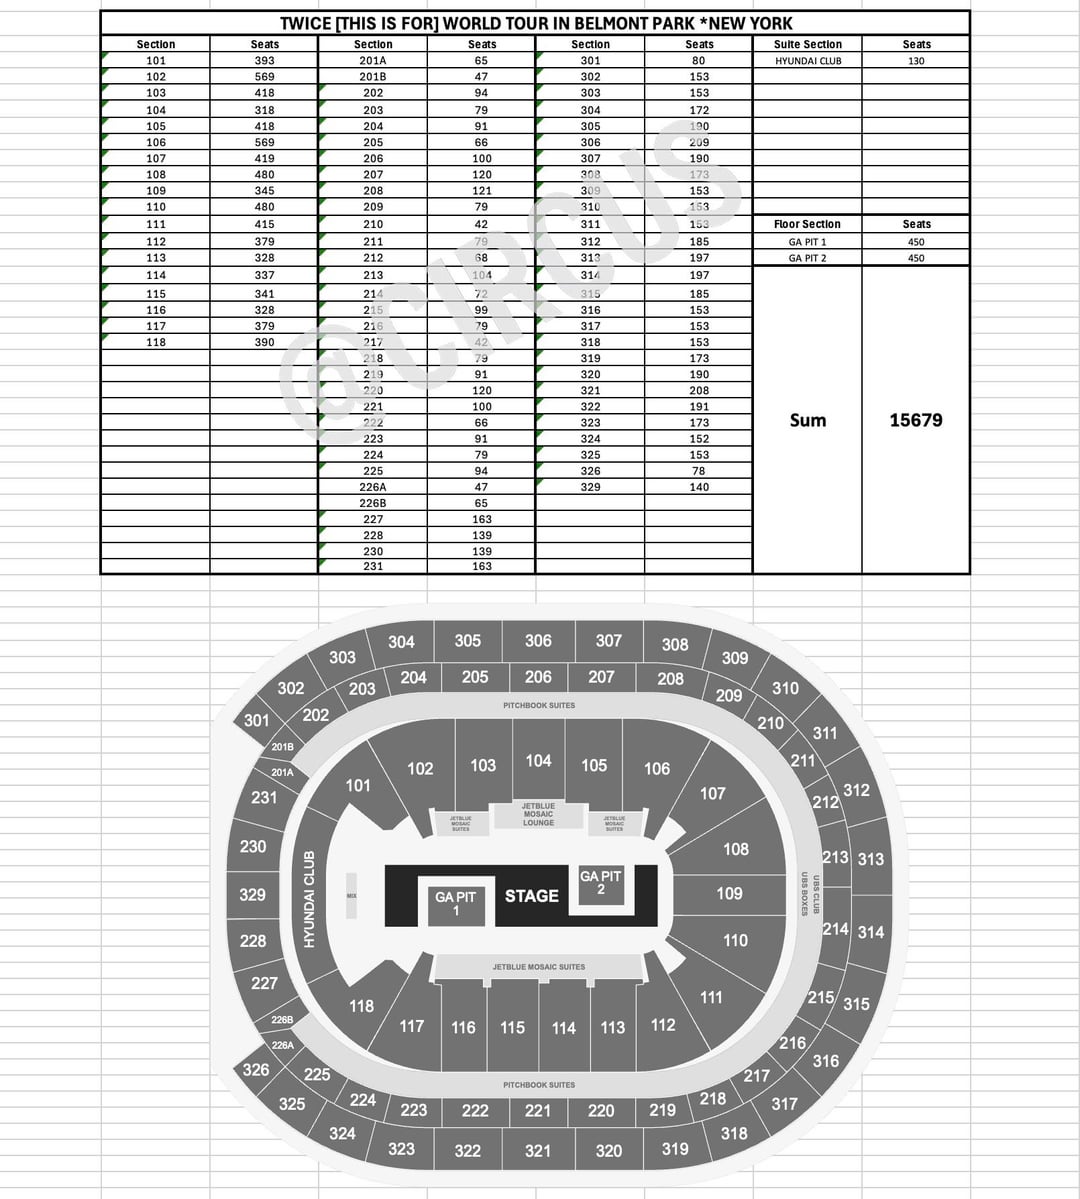
New York: 15679 PIT 900 (450 each)
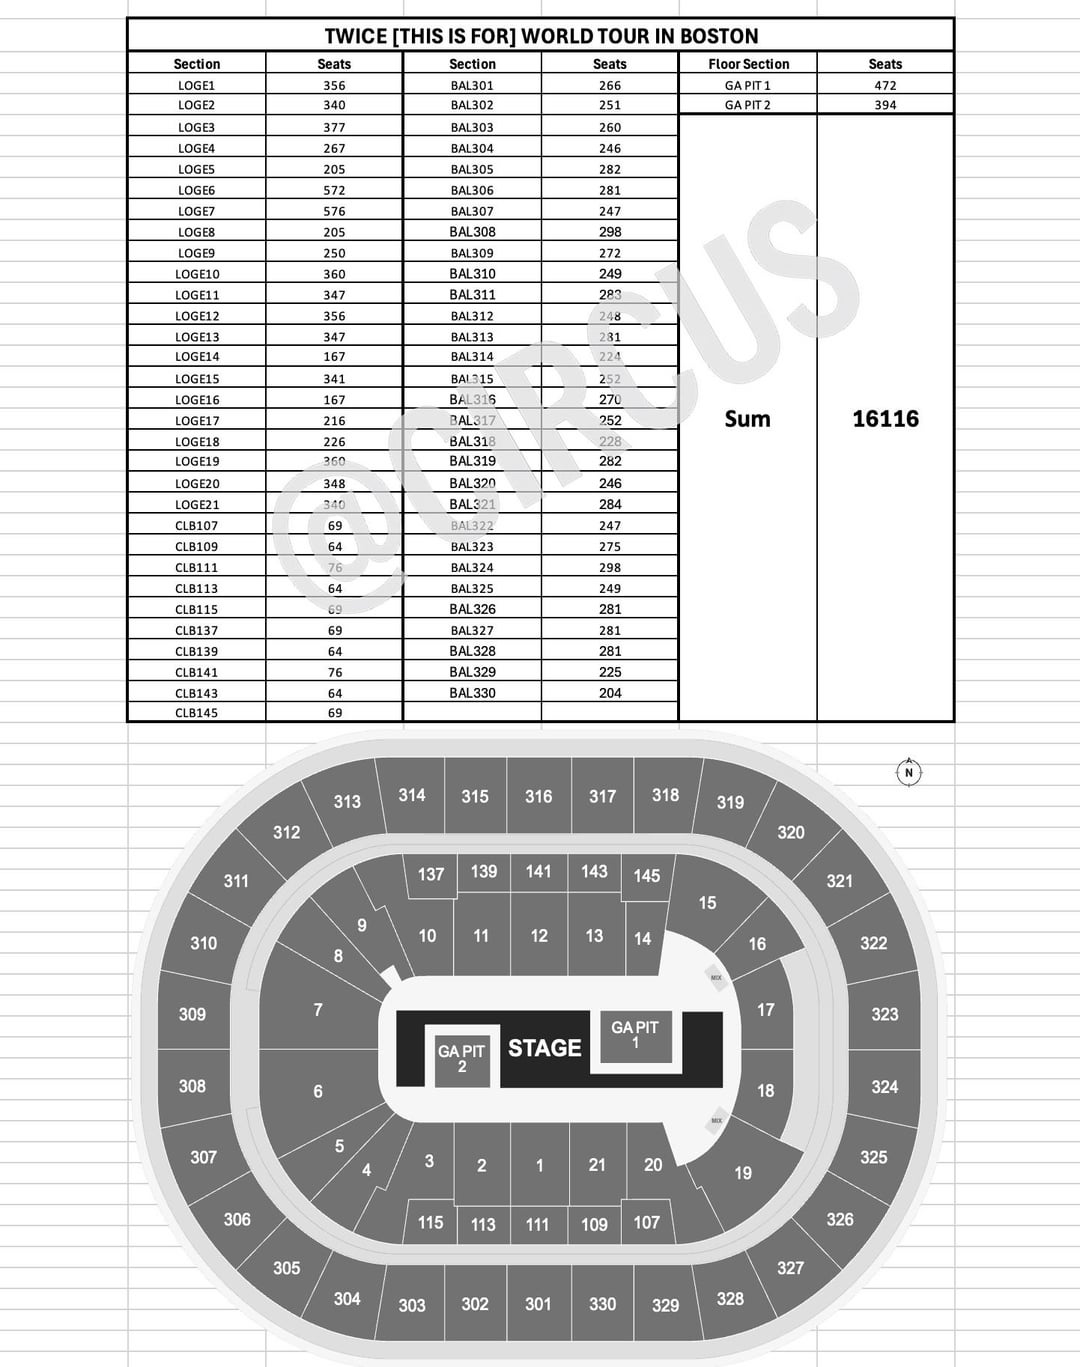
Boston: 16116 PIT 866 (472/394)
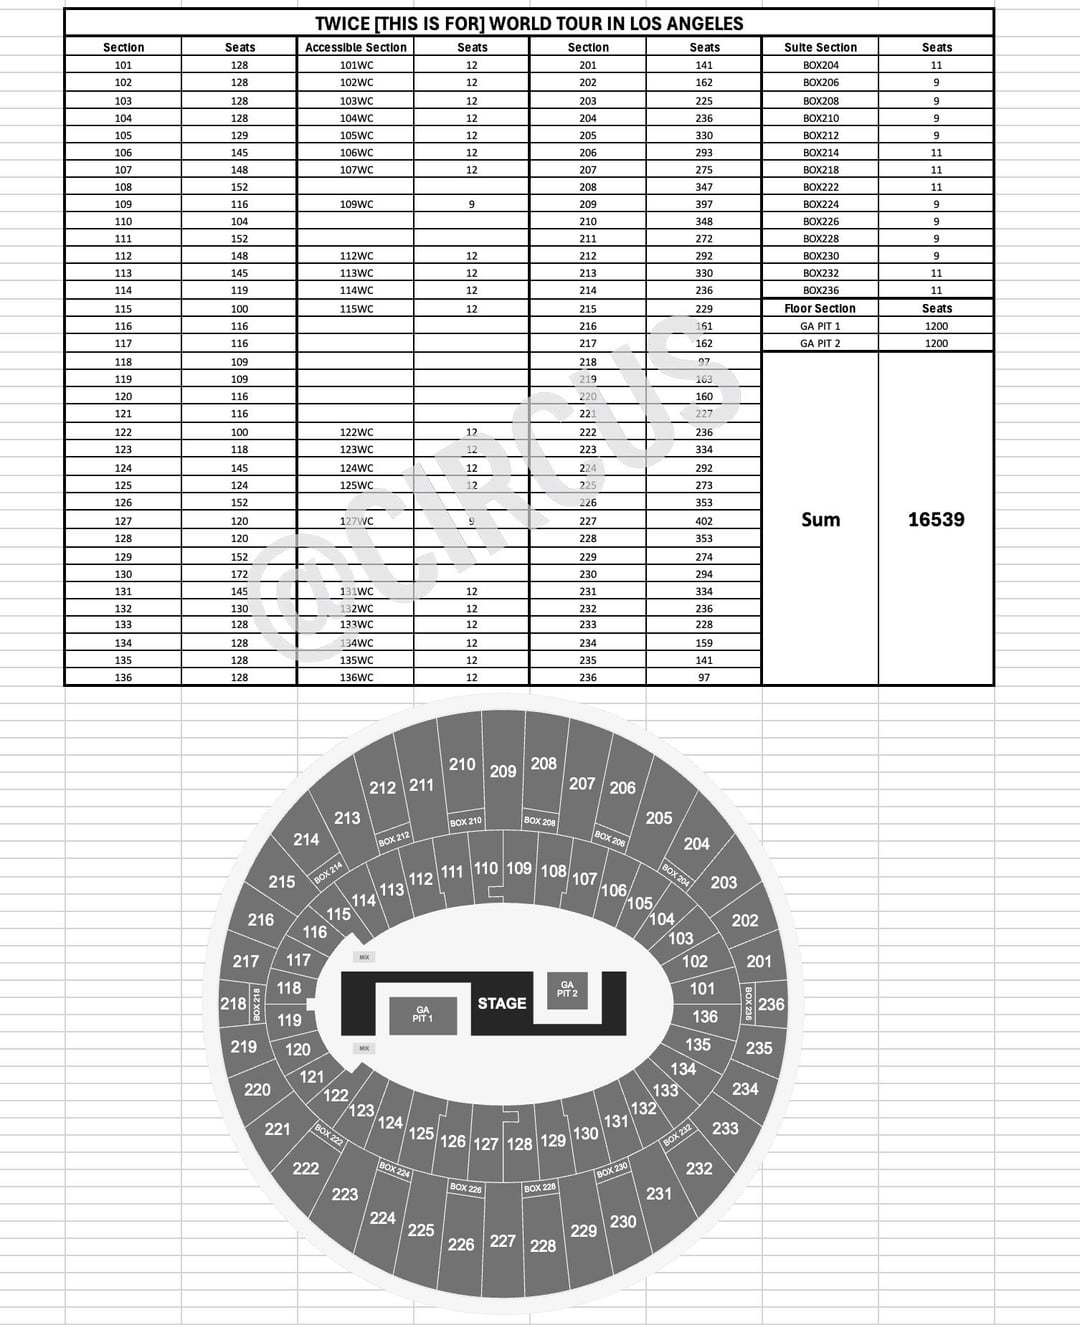
Los Angeles: 16539 PIT 2400 (1200 each)
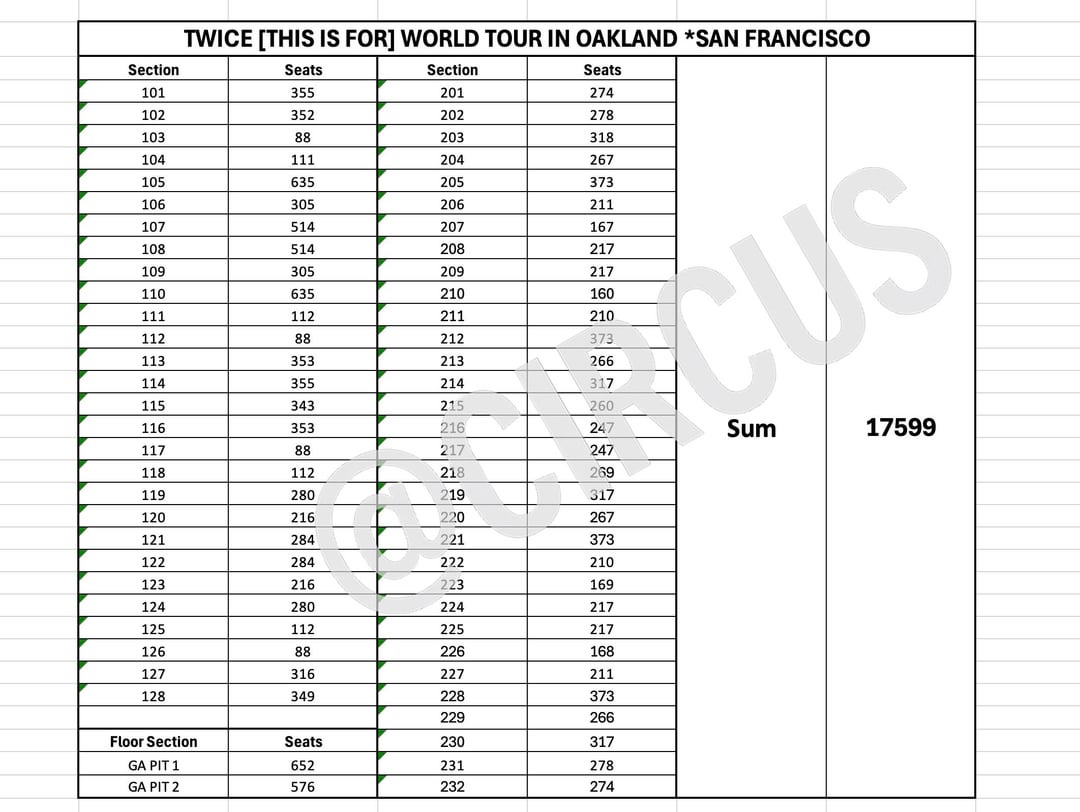
San Francisco: 17599 PIT 1228 (652/576)
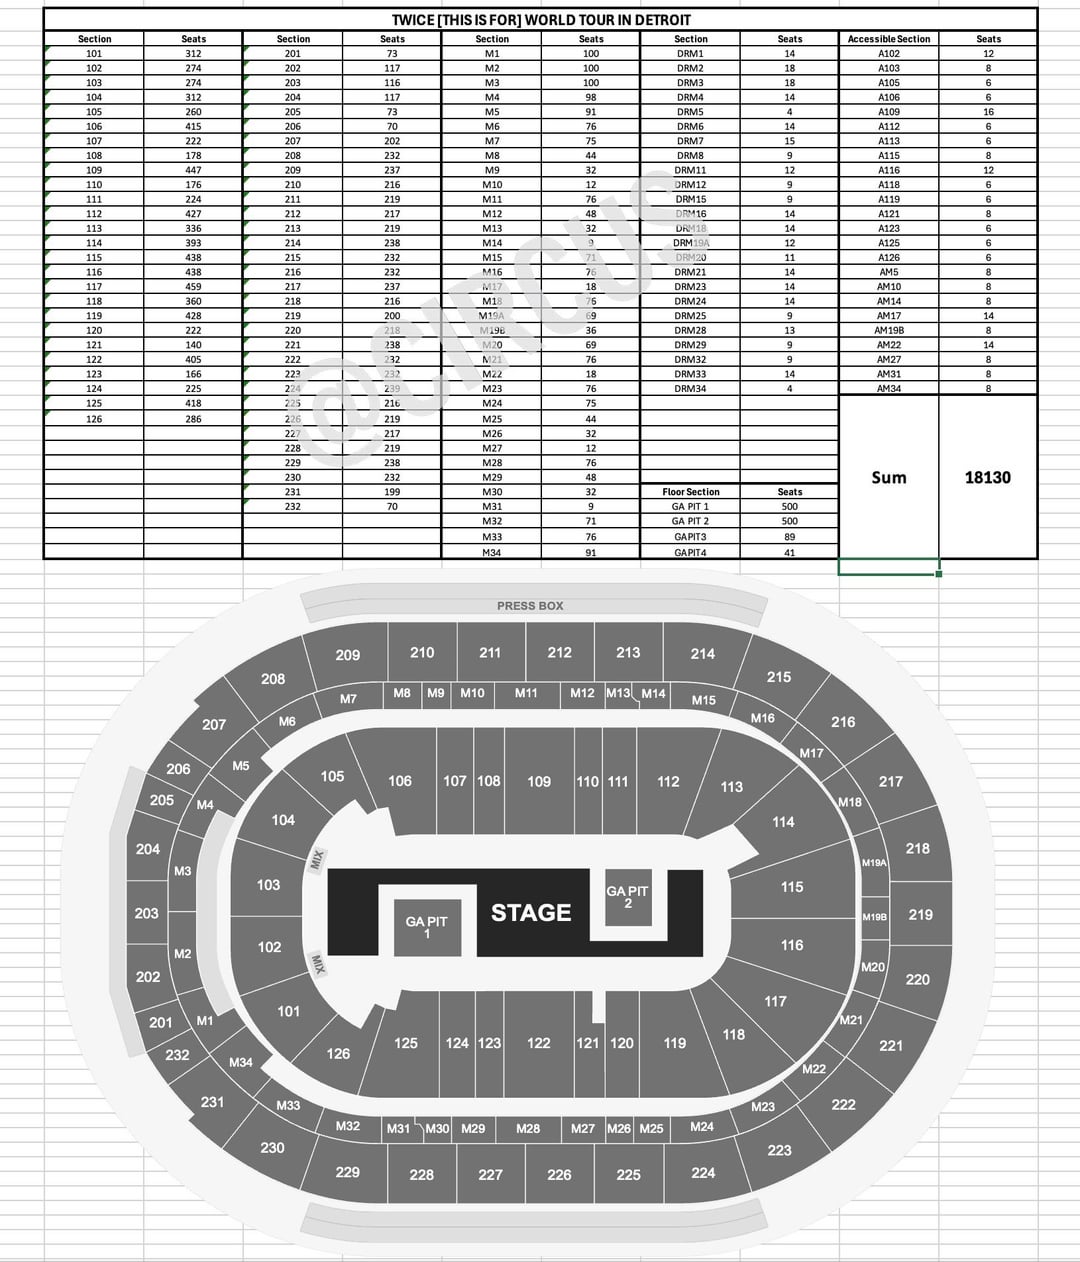
Detroit: 18130 PIT 1130 (589/541)
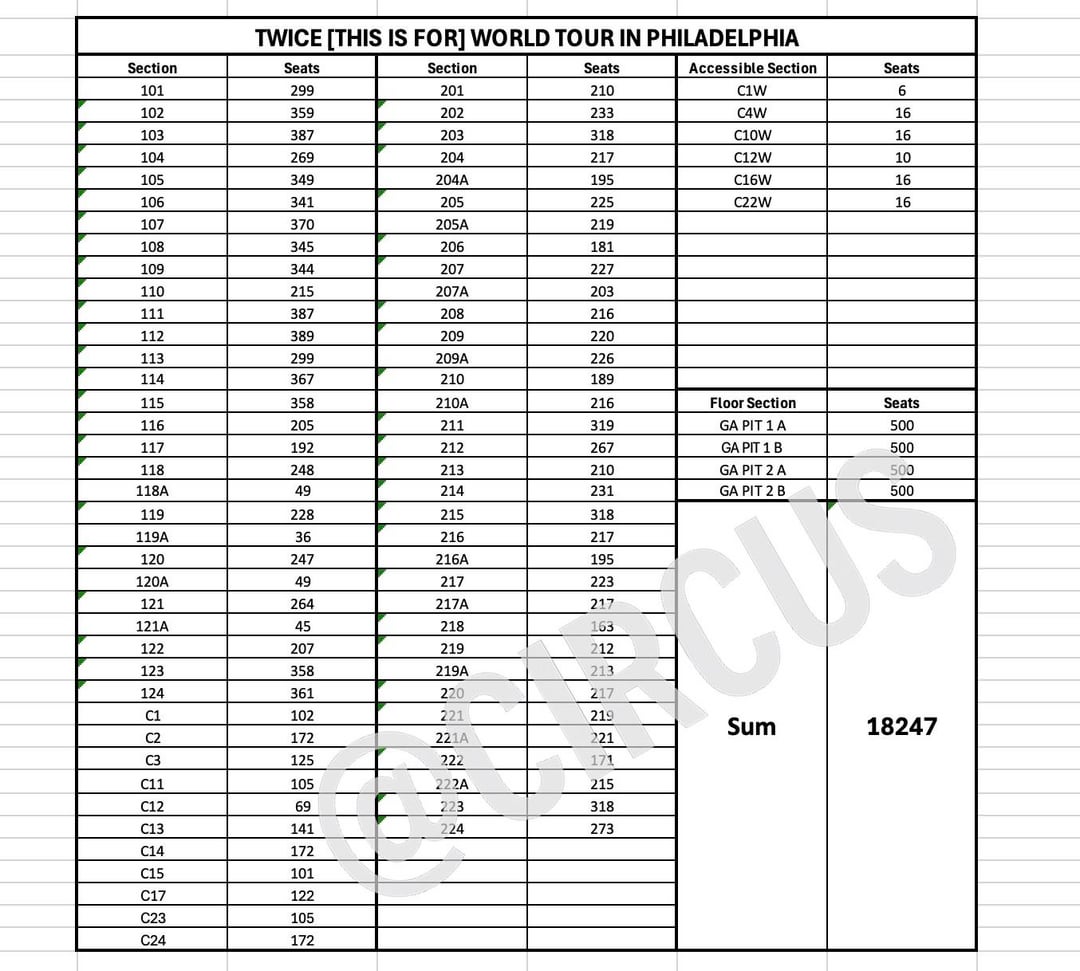
Philadelphia: 18247 PIT 2000 (1000 each)
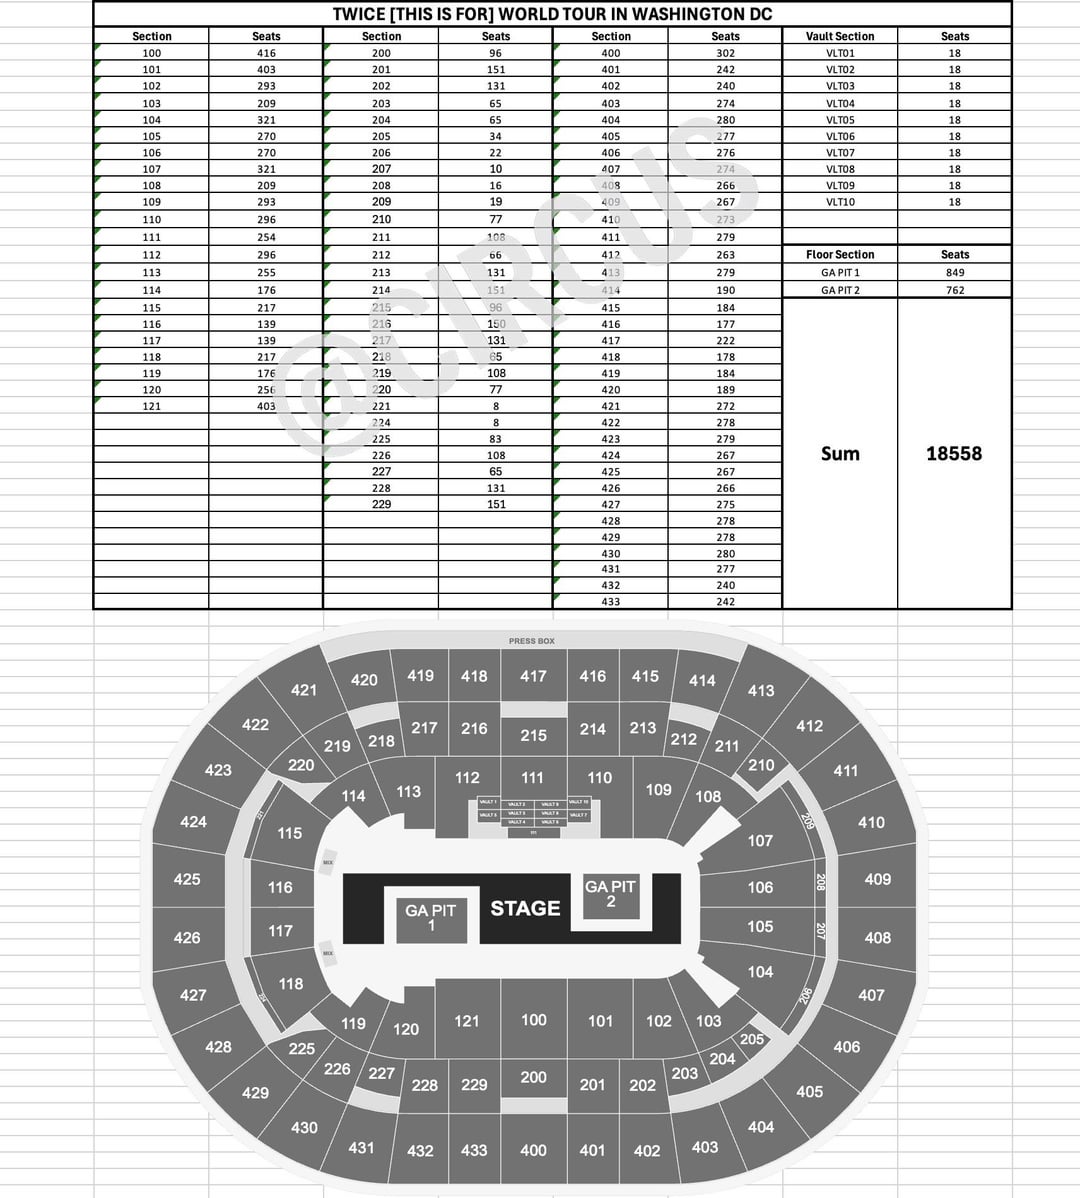
Washington DC: 18558 PIT 1611 (849/762)
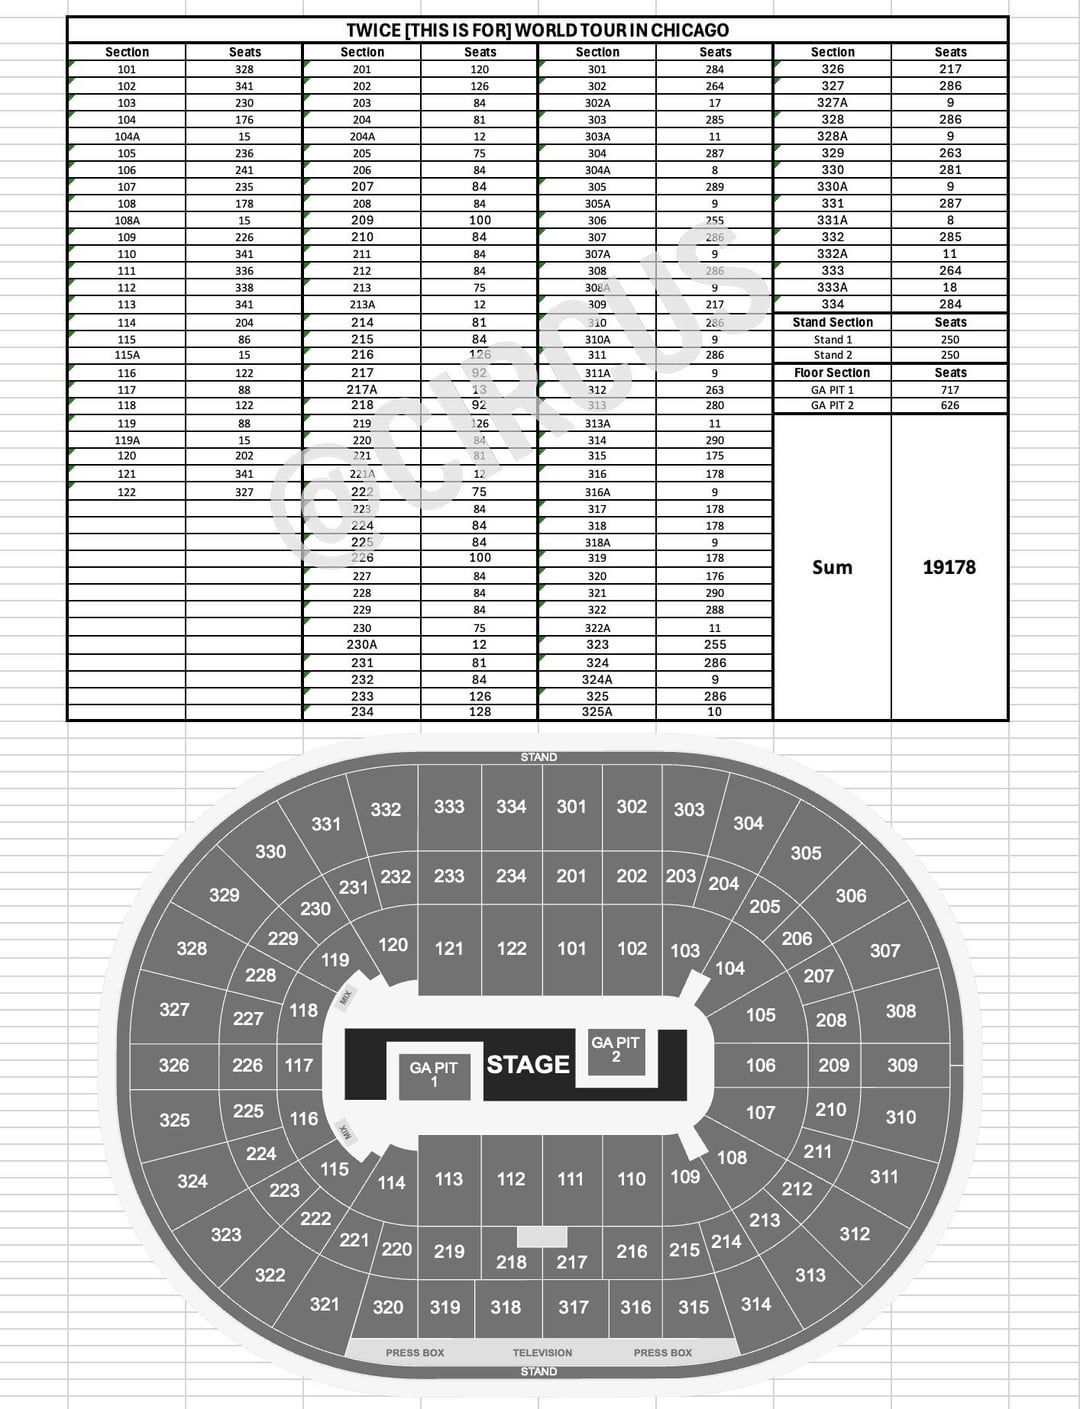
Chicago: 19178 PIT 1343 (717/626)
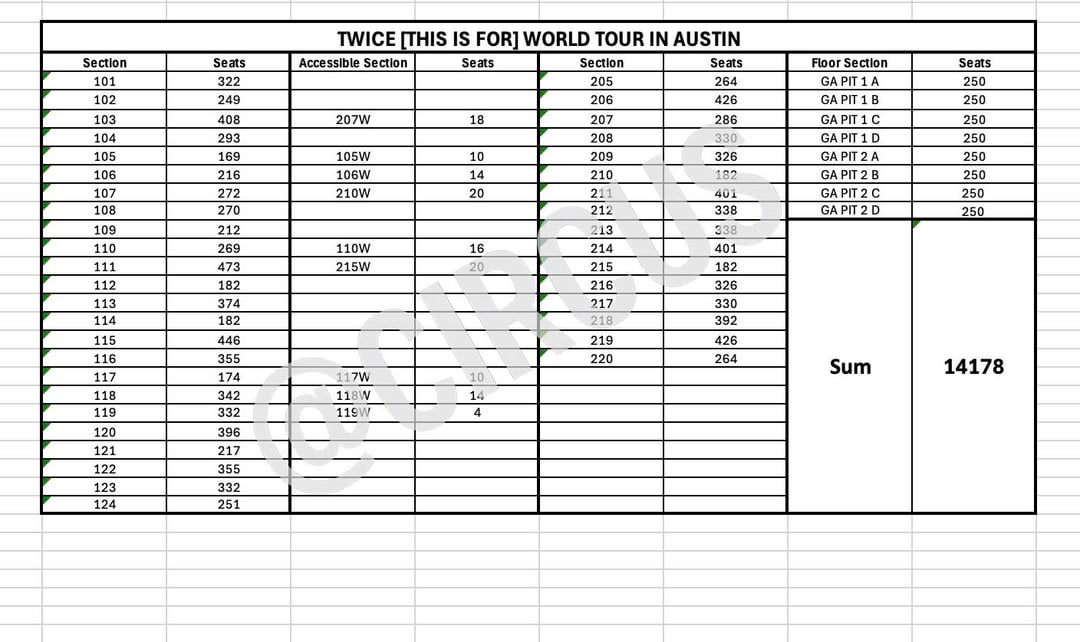
Austin: 14178 PIT 2000 (1000 each)
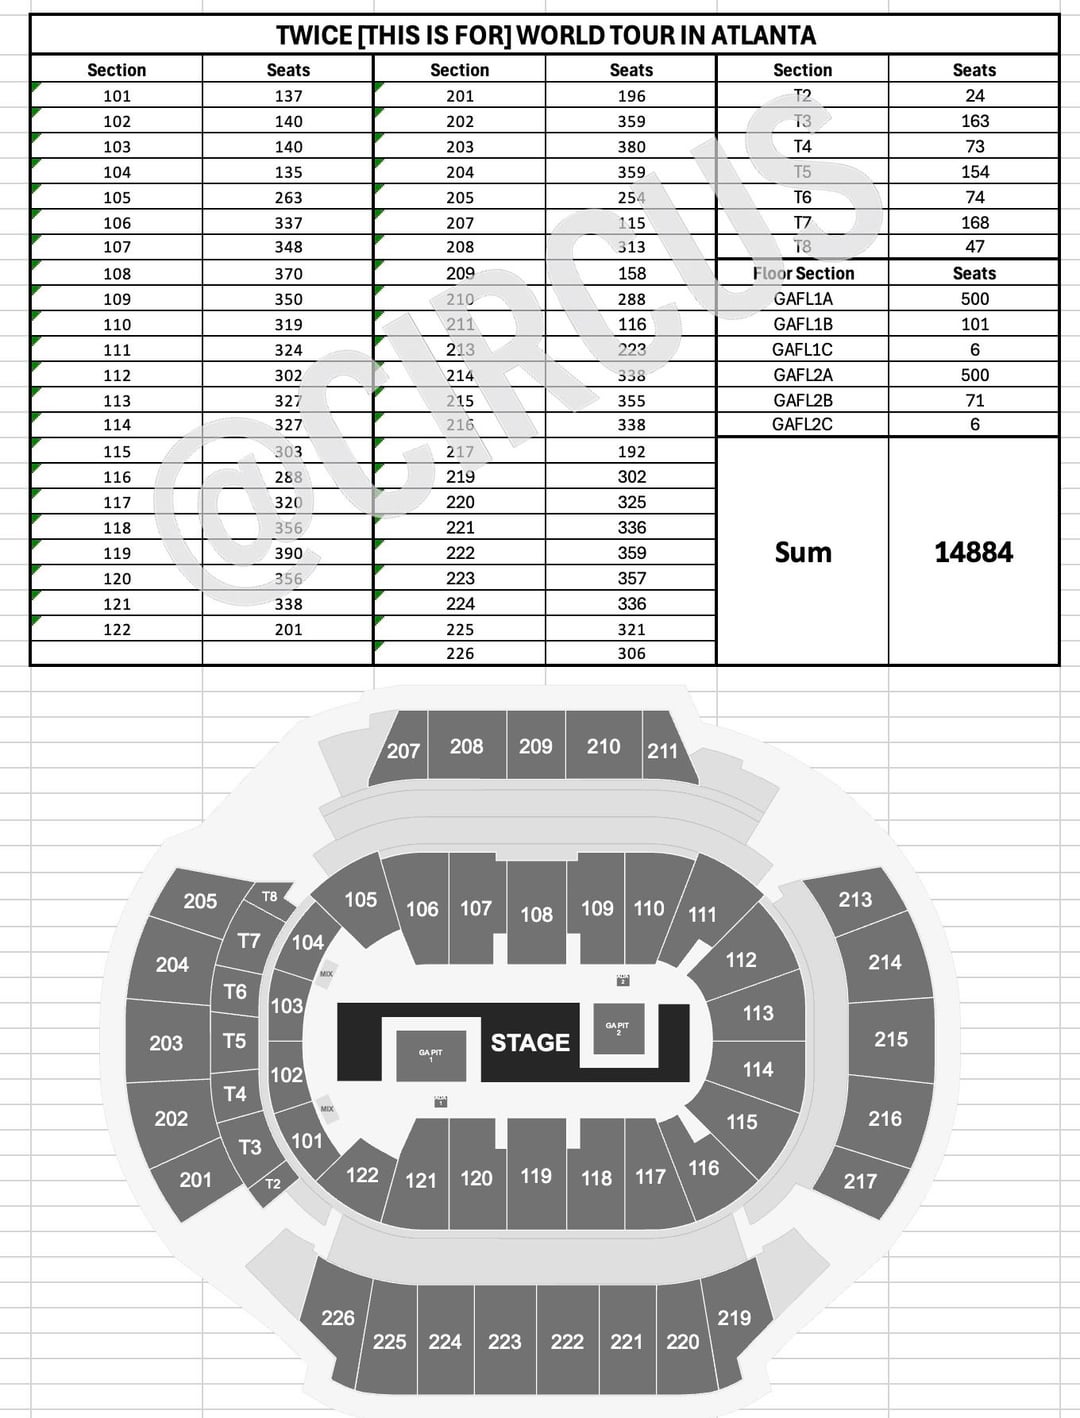
Atlanta: 14884 PIT 1184 (607/577)
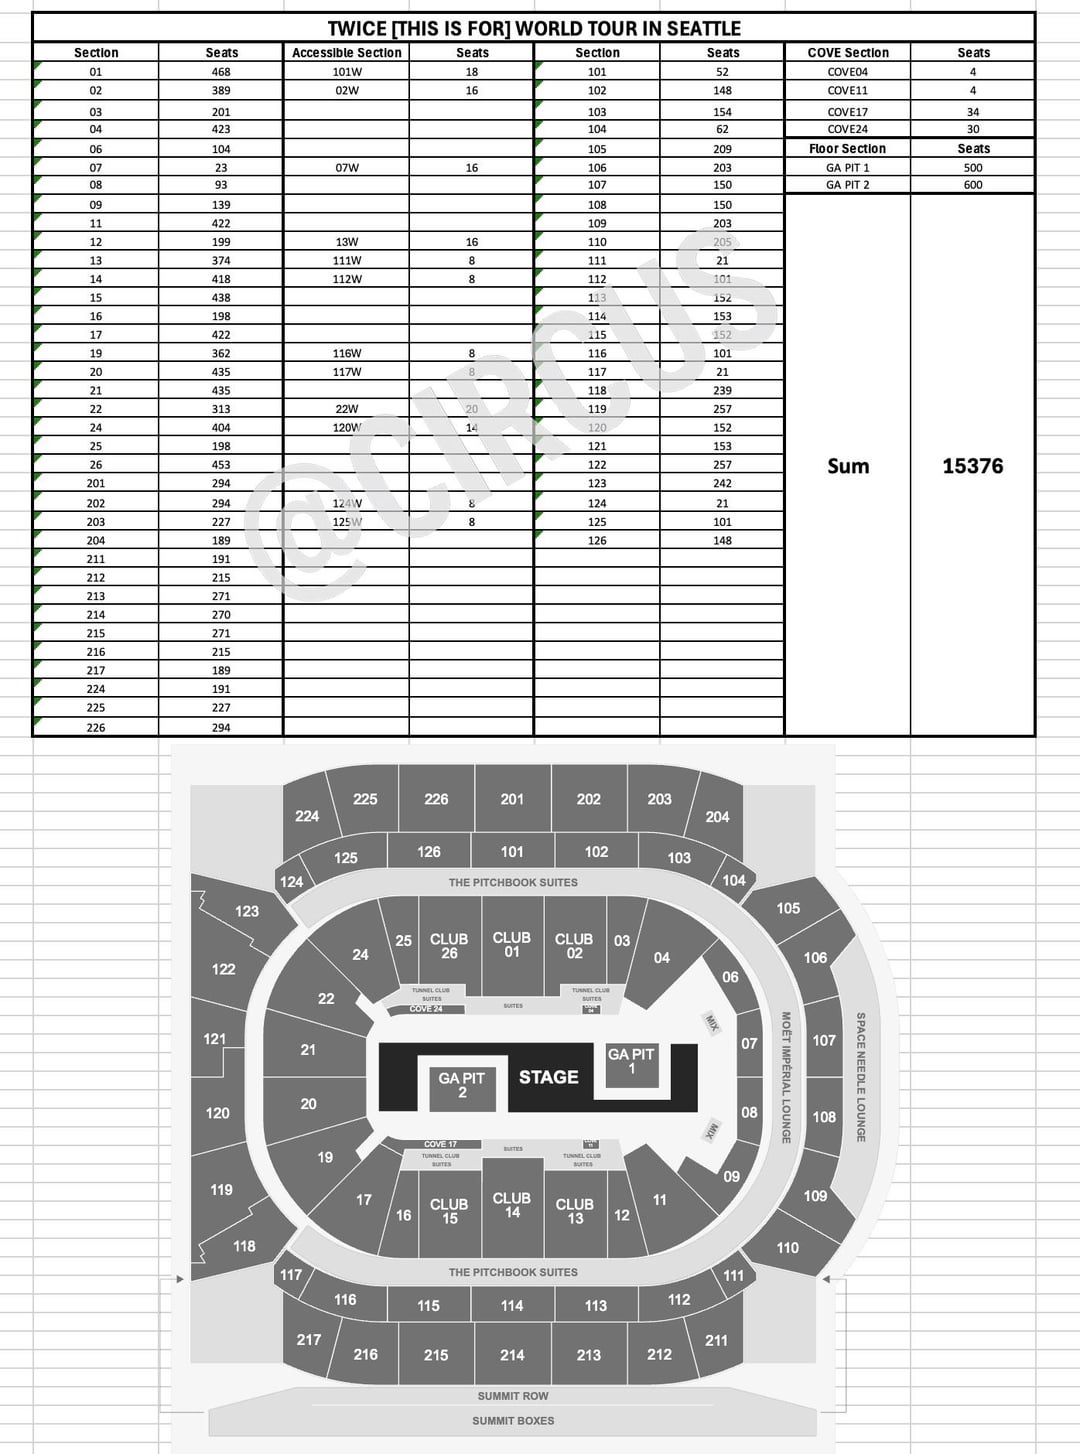
Seattle: 15376 PIT 1100 (500/600)
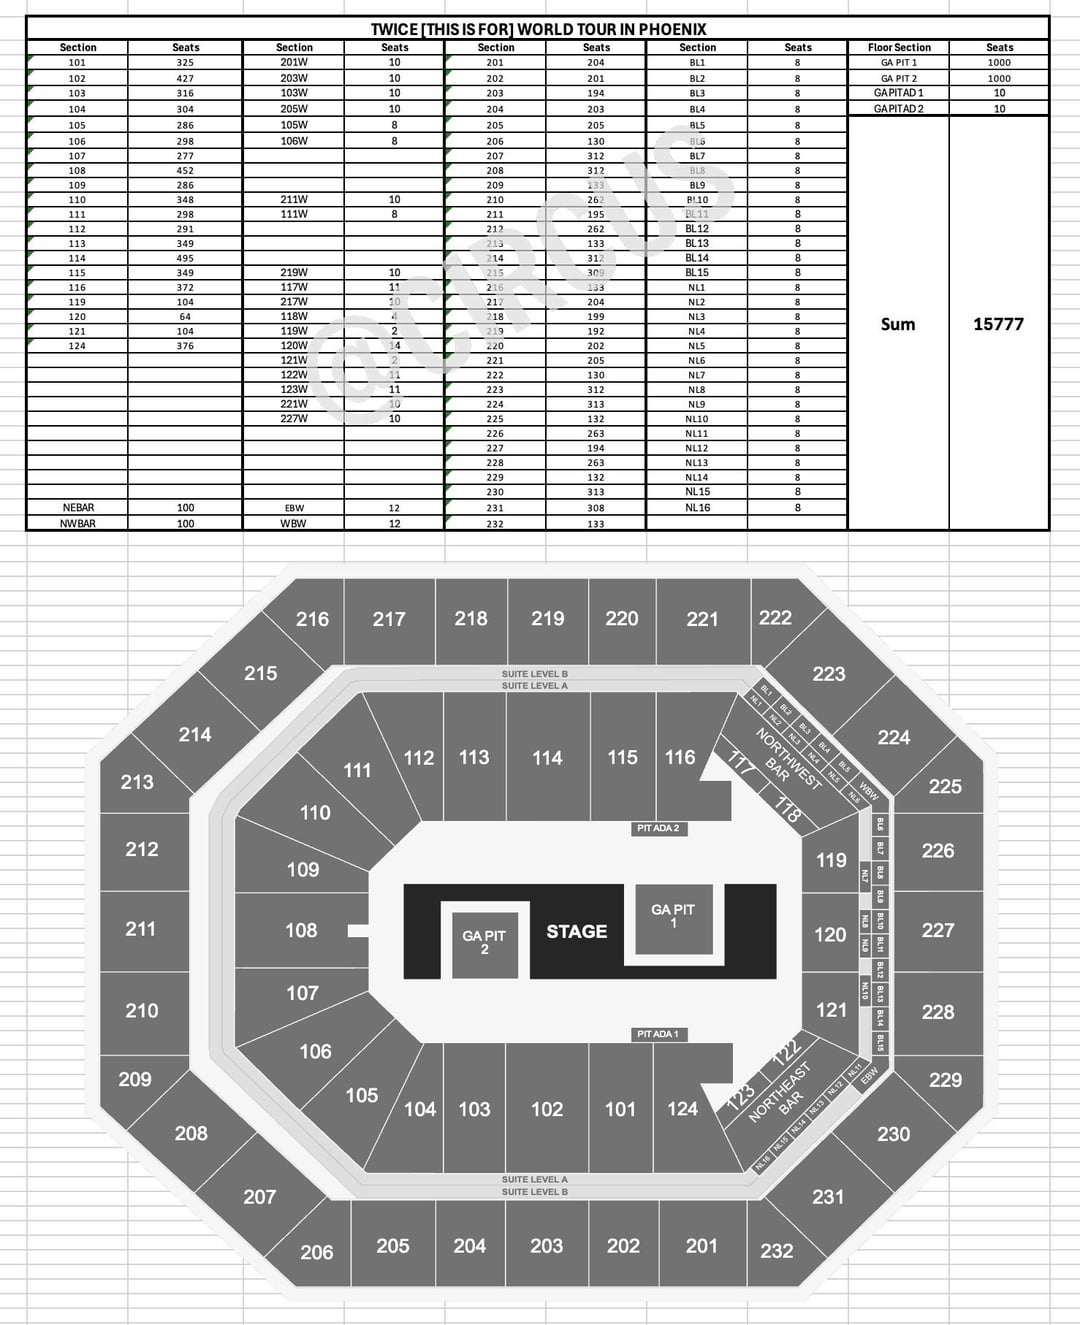
Phoenix: 15777 PIT 2020 (1000/1000/20 accessible seats)
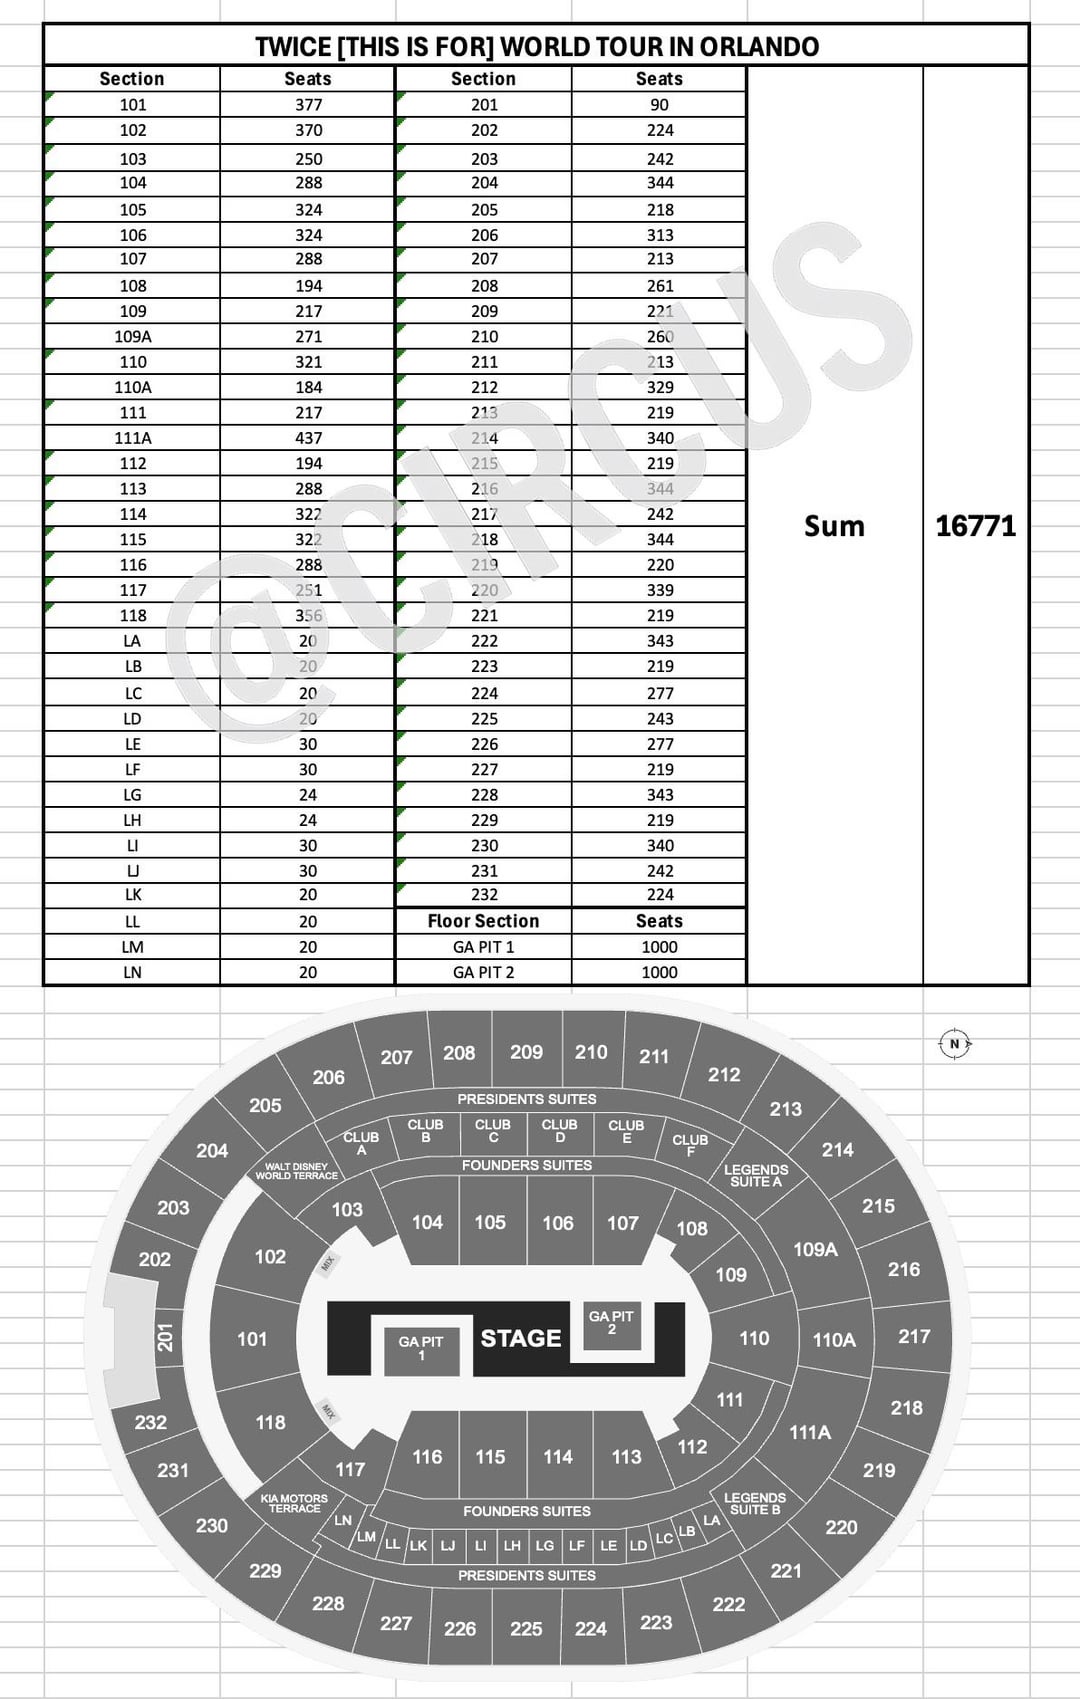
Orlando: 16771 PIT 2000 (1000 each)
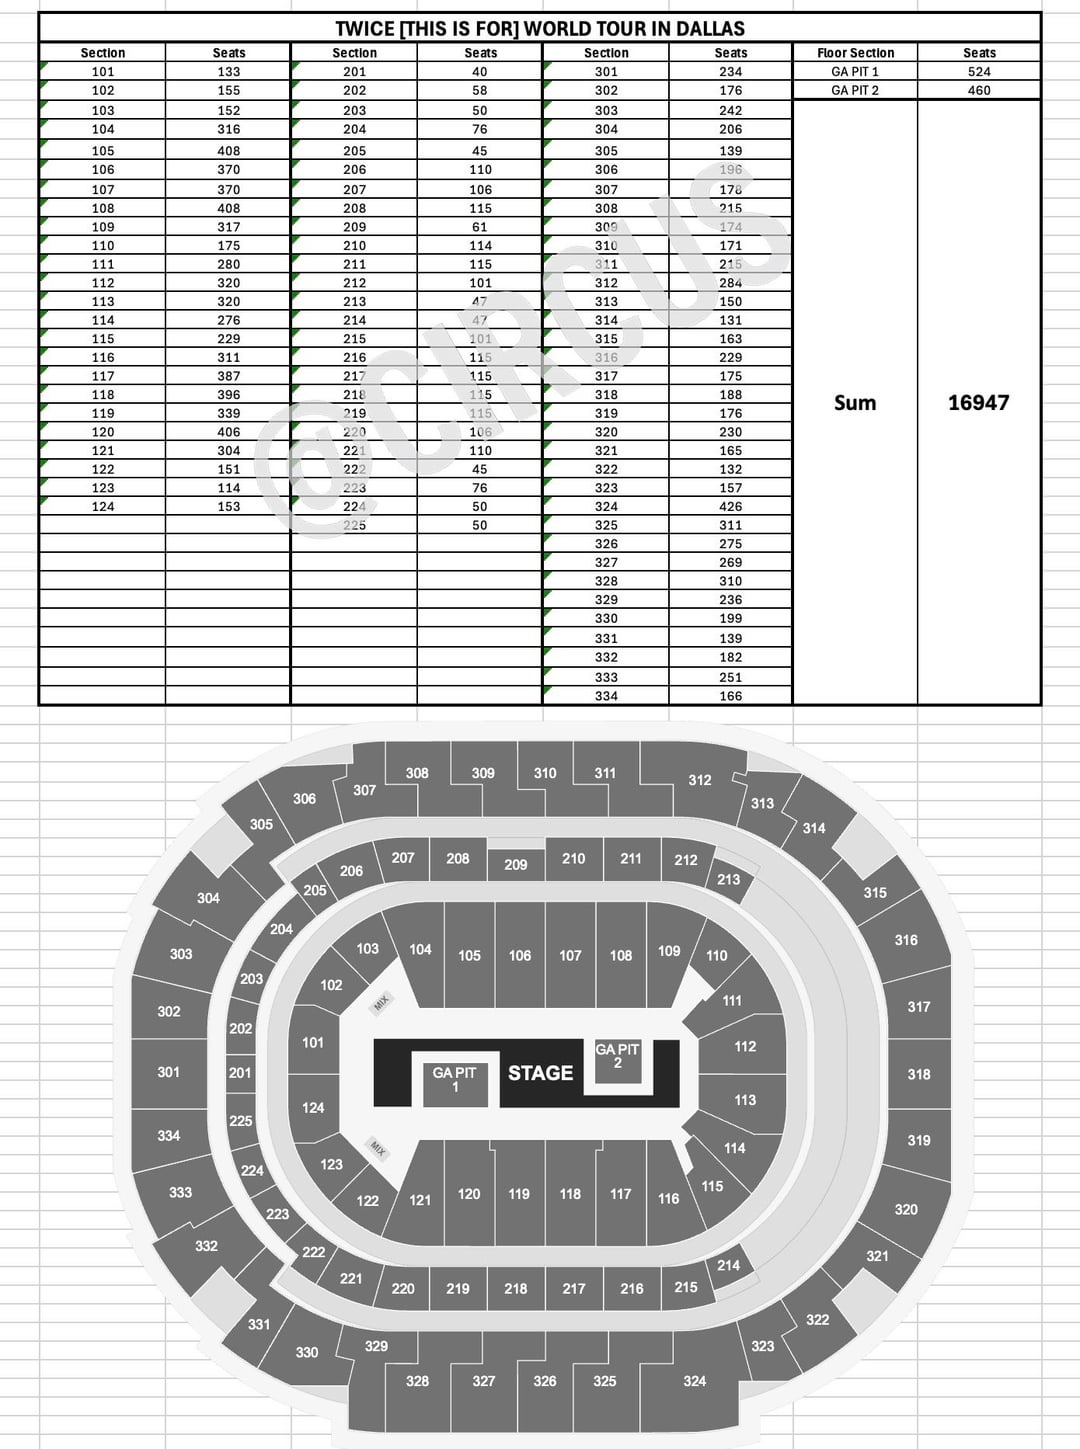
Dallas: 16947 PIT 984 (524/460)
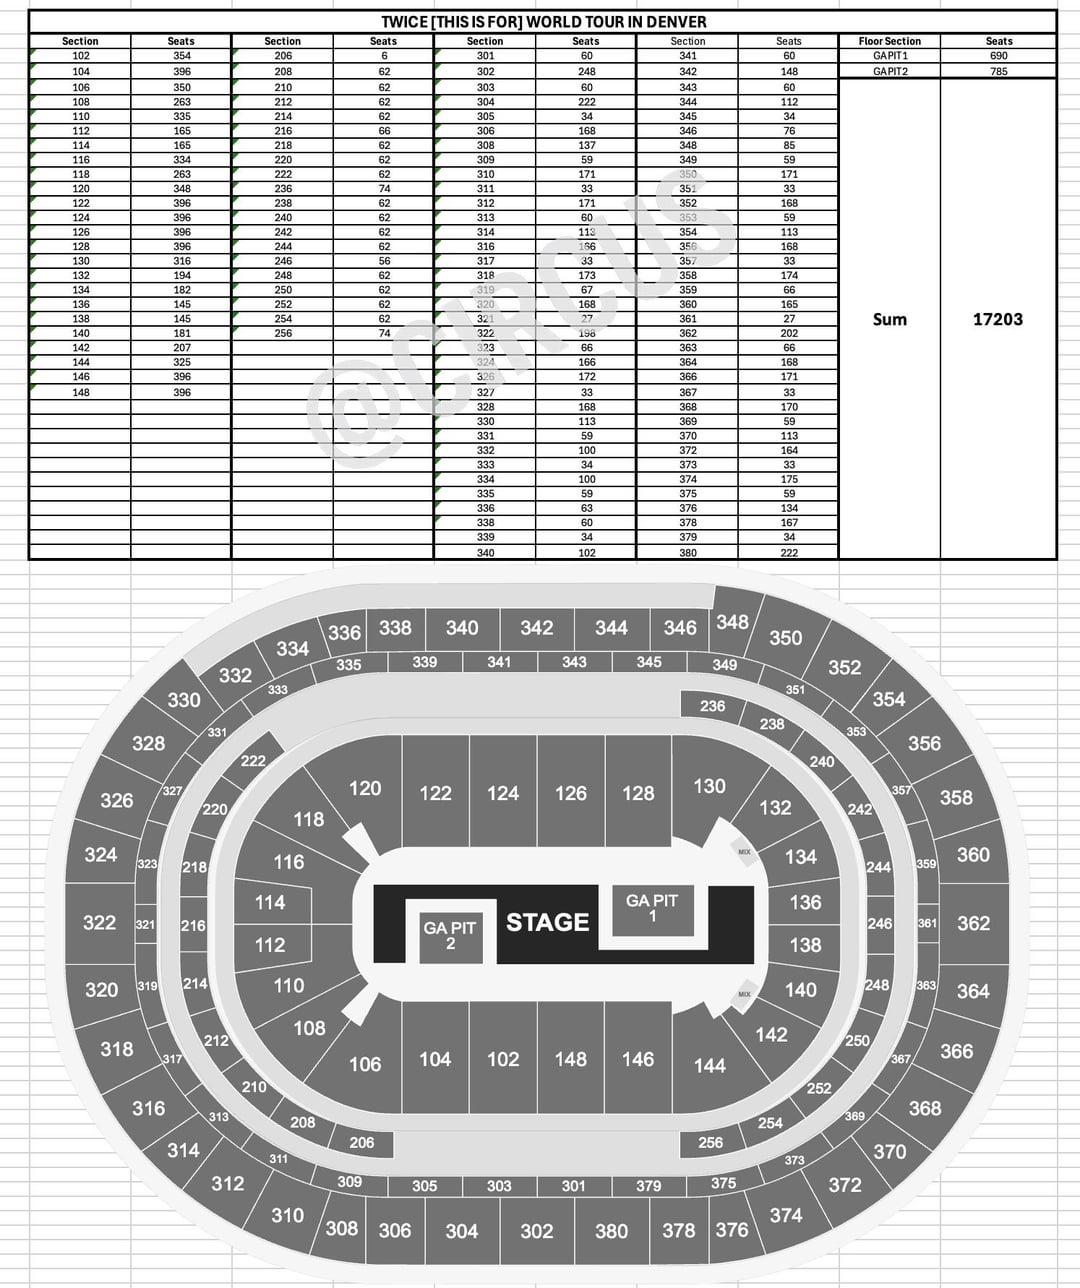
Denver: 17203 PIT 1475 (690/785)
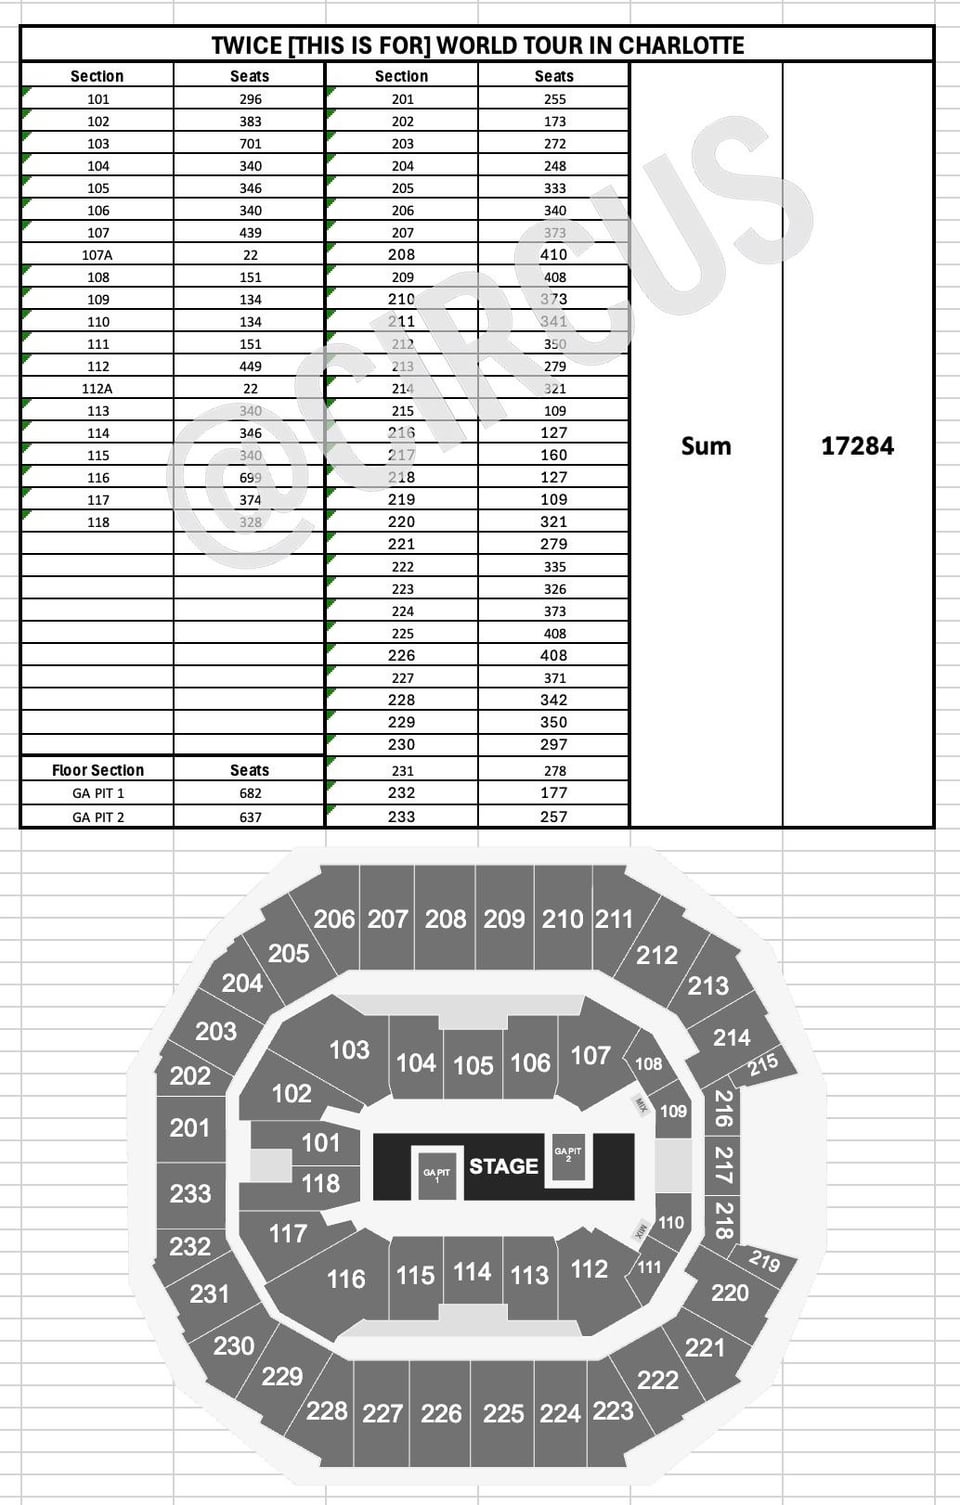
Charlotte: 17284 PIT 1319 (682/637)
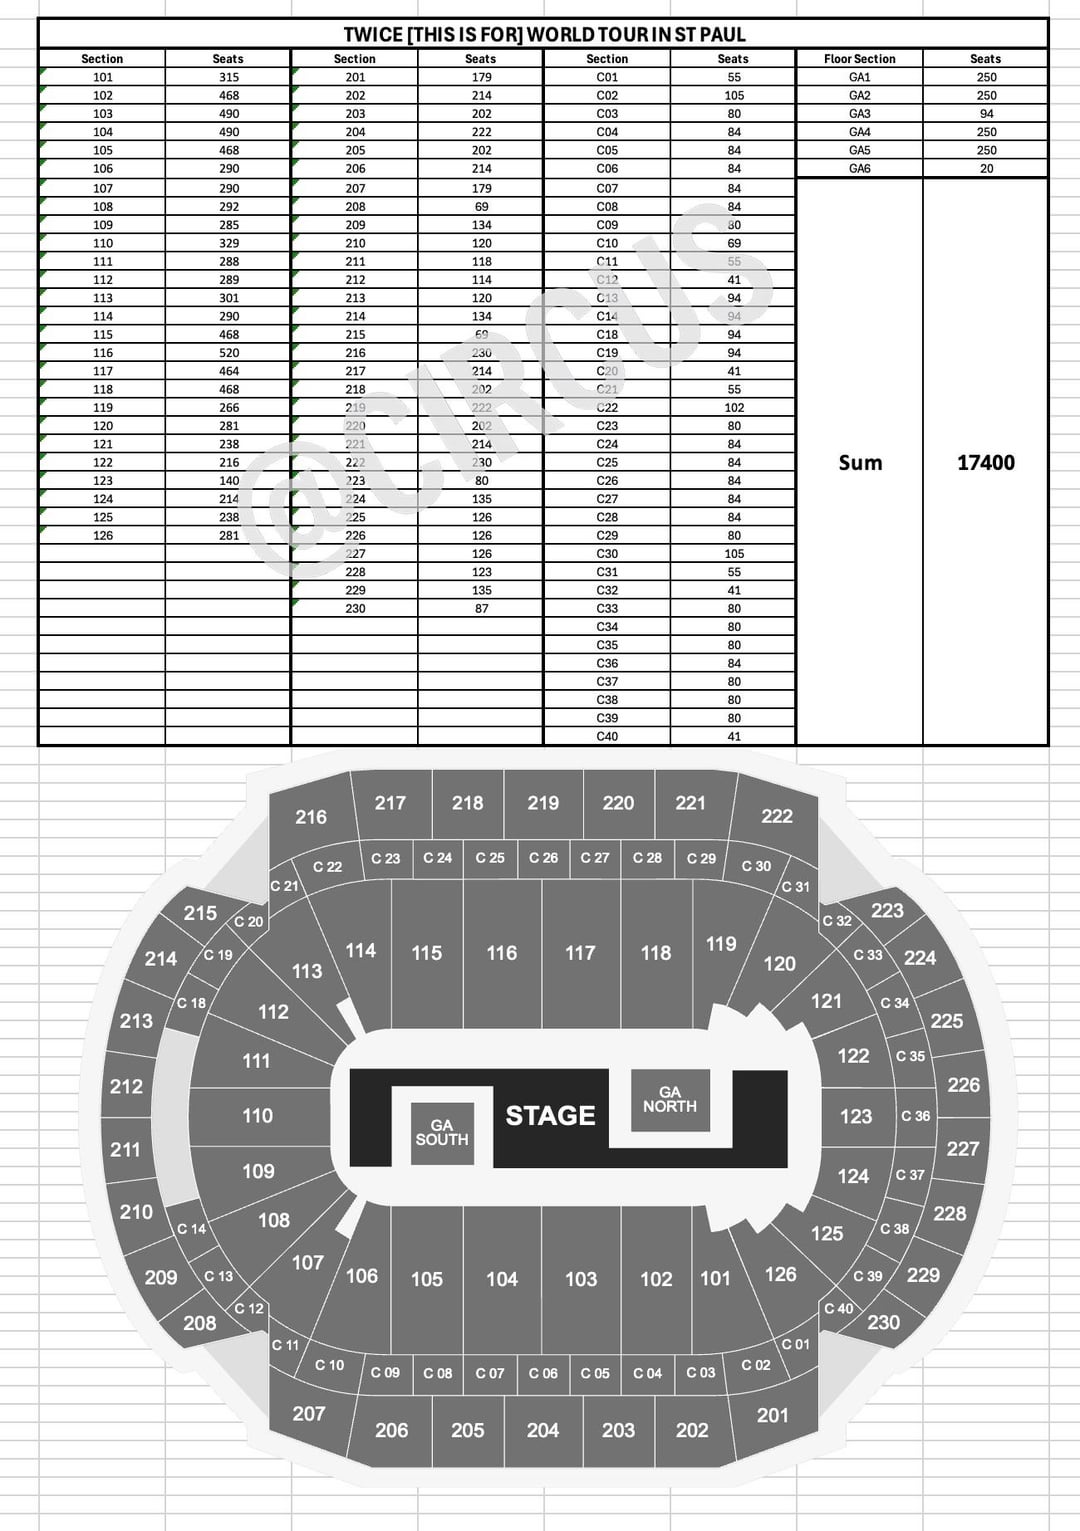
St. Paul: 17400 PIT 1114 (594/520)
by hehzz568
4 Comments
Not sure if this will help or hurt my anxiety for Thursday, but I appreciate the work and effort in putting this together. 👍
Very nice work OP! Every other country has had pit along the outer sections of the floor also. I’m wondering why the US isn’t following suit.
My heartrate spiked when I saw there’s less than 1000 PIT tickets for Dallas.
Wow this is wild, thanks a lot for doing this!